
Ready-to-Use Antibody–Antigen Affinity Data for Faster Biochemical Research
Ideal for biotech, pharmaceutical, and academic research teams looking to optimize results with reliable, ready-made data.

Boost your antibody engineering and antigen-binding studies with curated, high-accuracy datasets.
Our pre-analyzed statistical data helps improve antibody–antigen affinity, reduce lab time, and accelerate experimental success.
You can use the head data analysis provided on this page,
or use the calculation Server on the site by yourself.
or use the calculation Server on the site by yourself.
You can add only available information that you have , at your own discretion.
A side-by-side comparison of variant function measurements using deep mutational scanning
Part 1: Statistical Correlation Between Computational Predictions and Experimental Results
Discover how computed predictions align with real-world laboratory results. This section explores in-depth statistical correlations between theoretical models and experimental measurements—laying the foundation for data-driven validation in antibody–antigen research.
1---QVQLKQSGPG _LVQPSQSLSI __TCTVSGFSLT
31-NYGVHWVRQS_PGKGLEWLGV _IWSGGNTDYN
61- TPFTSRLSIN __KDNSKSQVFF __KMNSLQSNDT
91--ATYYCARALT _YYDYEFAYWG _QGTLVTVSAA
121-STKGPSVFPL _APSSKSTSGG ___TAALGCLVKD
151-YFPEPVTVSW _NSGALTSGVH __TFPAVLQSSG
181-LYSLSSVVTV _PSSSLGTQTY___ ICNVNHHKPSN TKVDKRVEPK
31-NYGVHWVRQS_PGKGLEWLGV _IWSGGNTDYN
61- TPFTSRLSIN __KDNSKSQVFF __KMNSLQSNDT
91--ATYYCARALT _YYDYEFAYWG _QGTLVTVSAA
121-STKGPSVFPL _APSSKSTSGG ___TAALGCLVKD
151-YFPEPVTVSW _NSGALTSGVH __TFPAVLQSSG
181-LYSLSSVVTV _PSSSLGTQTY___ ICNVNHHKPSN TKVDKRVEPK
T97CYS
T97D
T97S
G30TYR
Q27TYR
A25V
T97D
T97S
G30TYR
Q27TYR
A25V
PDB: 6ARU
PDB: 1YY9
Humanization of murine antibody 225 to create hu225. Heavy and light variable domains of 225, hu225 .
Structure of Cetuximab Fab mutant in complex with EGFR extracellular domain
1---DILLTQSPVI__ __LSVSPGERVS__ FSCRASQSIG
31--TNHIHYQQRT __NGSPRLLIKY __ADESIDGIPS
61--RFSGSGSGTD __FTLSINSVES ___EDIADYYCQQ
91--NNNWPTTFGA _GTKLELKRTV__ AAPSVFIFPP
121-SDEQLKSGTA __SVVCLLNNFY -PREAKVQWKV
151-DNALQSGNSQ _ESVTEQDSKD - STYSLSSTLT
181-LSKADYEKHK_ VYACEVTHQG _LSSPVTKSFN
31--TNHIHYQQRT __NGSPRLLIKY __ADESIDGIPS
61--RFSGSGSGTD __FTLSINSVES ___EDIADYYCQQ
91--NNNWPTTFGA _GTKLELKRTV__ AAPSVFIFPP
121-SDEQLKSGTA __SVVCLLNNFY -PREAKVQWKV
151-DNALQSGNSQ _ESVTEQDSKD - STYSLSSTLT
181-LSKADYEKHK_ VYACEVTHQG _LSSPVTKSFN
1---QVQLKQSGPG LVQPSQSLSI TCTVSGFSLT
31-NYGVHWVRQS PGKGLEWLGV IWSGGNTDYN
61-TPFTSRLSIN KDNSKSQVFF KMNSLQSNDT
91-AIYYCARALT YYDYEFAYWG QGTLVTVSAA
121-STKGPSVFPL APSSKSTSGG TAALGCLVKD
151-YFPEPVTVSW NSGALTSGVH TFPAVLQSSG
181-LYSLSSVVTV PSSSLGTQTY ICNVNHKPSN
TKVDKRVEPKS C DKTHTCPP CPAPELLGGP
31-NYGVHWVRQS PGKGLEWLGV IWSGGNTDYN
61-TPFTSRLSIN KDNSKSQVFF KMNSLQSNDT
91-AIYYCARALT YYDYEFAYWG QGTLVTVSAA
121-STKGPSVFPL APSSKSTSGG TAALGCLVKD
151-YFPEPVTVSW NSGALTSGVH TFPAVLQSSG
181-LYSLSSVVTV PSSSLGTQTY ICNVNHKPSN
TKVDKRVEPKS C DKTHTCPP CPAPELLGGP
1---DILLTQSPVI __ LSVSPGERVS __FSCRASQSIG
31-TNIHWYQQRT_ NGSPRLLIKY _ASESISGIPS
61--RFSGSGSGTD FTLSINSVES__ _EDIADYYCQQ
91-NNNWPTTFGA GTKLELKRTV__AAPSVFIFPP
121-SDEQLKSGTA SVVCLLNNFY __PREAKVQWKV
151DNALQSGNSQ ESVTEQDSKD_ STYSLSSTLT
181LSKADYEKHK VYACEVTHQG__LSSPVTKSFN
R GEC
31-TNIHWYQQRT_ NGSPRLLIKY _ASESISGIPS
61--RFSGSGSGTD FTLSINSVES__ _EDIADYYCQQ
91-NNNWPTTFGA GTKLELKRTV__AAPSVFIFPP
121-SDEQLKSGTA SVVCLLNNFY __PREAKVQWKV
151DNALQSGNSQ ESVTEQDSKD_ STYSLSSTLT
181LSKADYEKHK VYACEVTHQG__LSSPVTKSFN
R GEC
Cetuximab (USAN/INN);
Cetuximab (genetical recombination) (JAN);
Erbitux (TN)
Cetuximab (genetical recombination) (JAN);
Erbitux (TN)
1 -DILLTQSPVI _____LSVSPGERVS ___FSCRASQSIG
31-TNIHWYQQRT_ +NGSPRLLIKY ___ASESISGIPSP
61-RFSGSGSGTD__+FTLSINSVES ____EDIADYYCQQ
91-NNNWPTTFG A_ _GTKLELKRTV __AAPSVFIFPP
121SDEQLKSGTA__SVVCLLNNEFY __PREAKVQWKV
151DNALQSGNSQ__ESVTEQDSKD ___STYSLSSTLT
181-LSKADYEKHK _VYACEVTHQG__ _LSSPVTKSFN
R
31-TNIHWYQQRT_ +NGSPRLLIKY ___ASESISGIPSP
61-RFSGSGSGTD__+FTLSINSVES ____EDIADYYCQQ
91-NNNWPTTFG A_ _GTKLELKRTV __AAPSVFIFPP
121SDEQLKSGTA__SVVCLLNNEFY __PREAKVQWKV
151DNALQSGNSQ__ESVTEQDSKD ___STYSLSSTLT
181-LSKADYEKHK _VYACEVTHQG__ _LSSPVTKSFN
R
Heavy chain
Light chain
1--QVQLKQSGPG___LVQPSQSLSI ___TCTVSGFDLT
31-DYGVHWRQS___PGKGLEWLGV __IWSGGNTDYN
61-TPFTSRLSIN ____KDNSKSQVFF ___KMNSLQSND
91-AIYYCARALT___YDYEFAYWGG___QGTLVTVSAA
121-STKGPSVFPL __APSSKSTSGG ___TAALGCLVKD
151-YFPEPVTVSW __NSGALTSGVH __TFPAVLQSSG
181- LYSLSVSYTV__ PSSSLGTQTY ___ICNVNHHKPSN
TKVDKRVEPK SC
31-DYGVHWRQS___PGKGLEWLGV __IWSGGNTDYN
61-TPFTSRLSIN ____KDNSKSQVFF ___KMNSLQSND
91-AIYYCARALT___YDYEFAYWGG___QGTLVTVSAA
121-STKGPSVFPL __APSSKSTSGG ___TAALGCLVKD
151-YFPEPVTVSW __NSGALTSGVH __TFPAVLQSSG
181- LYSLSVSYTV__ PSSSLGTQTY ___ICNVNHHKPSN
TKVDKRVEPK SC
Y32R
G33D
V50L
V50Q
I51G
T57G
T57P
T100D
Y101W
F106TYR
G33D
V50L
V50Q
I51G
T57G
T57P
T100D
Y101W
F106TYR
Mutations:
Mutations:
[Deep mutational scanning of an antibody against epidermal growth factor receptor using mammalian cell display and massively paral]
Analyze the accuracy of your models with robust statistical methods.
Compare calculated antibody–antigen affinity data with experimental outcomes to validate predictions and enhance research reliability.
Compare calculated antibody–antigen affinity data with experimental outcomes to validate predictions and enhance research reliability.
Two types of experimental data: Kd and Enrichment Ratio (ER)
- The correlation between log(ER) and log(Kd) was reported to be modest, with an R² ≈ 0.29.
- This indicates a positive but noisy relationship: while higher ER values generally correlate with stronger binding (lower Kd), the correlation is not strong enough to predict precise affinities.
- Kd (Part I:(A)) and Enrichment Ratio (ER) (Part I:(B))
| Experimantal Kd data | Enrichment Ratio (ER) | |
|---|---|---|
| Fab1 (Heavy chain) | Fab2 (Light chain) | Fab1 (Heavy chain) |
|
VH:Y32R, VH:G33D, VH:V50L, VH:V50Q, VH:I51G, VH:T57G, VH:T57P, VH:T100D, VH:Y101W, VH:F106Y | VL:T97D, VL:T97S, VL:G30Y, VL:Q27Y, VL:A25V |
VH:N31A, VH:N31C, VH:N31D, VH:N31E, VH:N31F, VH:N31G, VH:N31H, VH:N31L, VH:N31M, VH:Y32A, VH:Y32C, VH:Y32D, VH:Y32F, VH:Y32G, VH:Y32I, VH:Y32K, VH:Y32L, VH:V50A, VH:V50C, VH:V50E, VH:V50F, VH:V50G, VH:V50I, VH:V50K, VH:V50L, VH:V50M, VH:V50N, VH:V50P, VH:V50Q, VH:V50R, VH:V50S, VH:V50T, VH:I51A, VH:I51C, VH:I51D, VH:I51F, VH:I51G, VH:I51H, VH:W52A, VH:W52C, VH:W52D, VH:W52E, VH:W52F, VH:W52G, VH:W52H, VH:W52I, VH:W52K, VH:W52L, VH:W52M, VH:W52P, VH:W52Q, VH:W52R, VH:W52S, VH:W52T, VH:W52V, VH:T57G, VH:T57H, VH:T57I, VH:T57L, VH:T57M, VH:T57N, VH:T57P, VH:T57Q, VH:T57R, VH:T57S, VH:D58A, VH:Y59C, VH:Y59D, VH:V50L, VH:V50Q, VH:I51G, VH:W52G, VH:W52T, VH:T57G, VH:T57P, VH:T57S, VH:Y59C |
Understanding how protein function is encoded at the residue level is a central challenge in modern protein science. Mutations can cause diseases and drive evolution through perturbing protein function in a myriad of ways, such as by altering its conformational ensemble and stability or its interaction with ligands and binding partners. In these contexts, mutations may result in a loss of function, gain of function, or a neutral phenotype (i.e., no discernable effects). Mutations also often exert effects across multiple phenotypes, and these perturbations can ultimately propagate to alter complex processes in cell biology and physiology. Reverse genetics approaches offer a powerful handle for researchers to investigate biology via introducing mutations and observing the resulting phenotypic changes.
Deep mutational scanning (DMS) is a technique for systematically determining the effect of a large library of mutations individually on a phenotype of interest by performing pooled assays and measuring the relative effects of each variant
Deep mutational scanning (DMS) is a technique for systematically determining the effect of a large library of mutations individually on a phenotype of interest by performing pooled assays and measuring the relative effects of each variant
mutational effects is a key goal in evolutionary biology. Recently developed deep-sequencing approaches allow for accurate and simultaneous estimation of the fitness effects of hundreds of engineered mutations by monitoring their relative abundance across time points in a single bulk competition. Naturally, the achievable resolution of the estimated fitness effects depends on the specific experimental setup, the organism and type of mutations studied, and the sequencing technology utilized, among other factors. By means of analytical approximations and simulations, we provide guidelines for optimizing time-sampled deep-sequencing bulk competition experiments, focusing on the number of mutants, the sequencing depth, and the number of sampled time points. Our analytical results show that sampling more time points together with extending the duration of the experiment improves the achievable precision disproportionately compared with increasing the sequencing depth or reducing the number of competing mutants. Even if the duration of the experiment is fixed, sampling more time points and clustering these at the beginning and the end of the experiment increase experimental power and allow for efficient and precise assessment of the entire range of selection coefficients. Finally, we provide a formula for calculating the 95%-confidence interval for the measurement error estimate, which we implement as an interactive web tool. This allows for quantification of the maximum expected a priori precision of the experimental setup, as well as for a statistical threshold for determining deviations from neutrality for specific selection coefficient estimates.
Deep mutational scanning (DMS) is a powerful technique used to systematically analyze the effects of all possible amino acid mutations on a protein's function, particularly in the context of antibodies. This approach involves creating large libraries of antibody variants with diverse mutations, followed by functional screening and deep sequencing to quantify the impact of each mutation on antibody properties like binding affinity, specificity, and stability.
Affinity measurements of chimeric and humanized anti-EGFR antibodies, as determined by surface plasmon resonance (Biacore), luminescent oxygen-channeling immunoassay (AlphaLISA) and flow cytometry.
Humanization of murine antibody 225 to create hu225. heavy and light variable domains of 225, hu225 and human acceptor frameworks 60P2 and NOV. CDRs are underlined in 225. Framework positions in hu225 where murine residues were retained are shown in bold and underlined. At VH position 12 double underlined and bold indicates where the infrequent Ile found in 60P2 was changed to Val as found in the human VH3 family consensus.

| Group | Fab's Mutation | Kd(nM) Experiment | lg[Kd] Calculat. | ΔΔG | TΔS |
|---|---|---|---|---|---|
| EGFR-mutFab1-Fab2 | Y32R | 6.800000 | 13.511289 | -2.58E-08 | 0.000641 |
| EGFR-mutFab1-Fab2 | G33D | 1.900000 | 13.511047 | 3.66E-08 | -0.000738 |
| EGFR-mutFab1-Fab2 | V50L | 3.100000 | 13.511175 | 2.15E-10 | -0.000007 |
| EGFR-mutFab1-Fab2 | V50Q | 2.900000 | 13.511182 | 3.40E-09 | 0.000030 |
| EGFR-mutFab1-Fab2 | I51G | 3.600000 | 13.511205 | -1.62E-09 | 0.000162 |
| EGFR-mutFab1-Fab2 | T57G | 3.900000 | 13.511229 | 9.75E-10 | 0.000300 |
| EGFR-mutFab1-Fab2 | T57P | 3.800000 | 13.511126 | -1.62E-10 | -0.000287 |
| EGFR-mutFab1-Fab2 | T100D | 1.600000 | 13.511116 | 1.55E-09 | -0.000345 |
| EGFR-mutFab1-Fab2 | Y101W | 5.800000 | 13.511206 | -2.11E-08 | 0.000168 |
| EGFR-mutFab1-Fab2 | F106TYR | 4.000000 | -- | -- | -- |
| EGFR-Fab1-mutFab2 | T97CYS | 3.6 | 13.51143035 | 1.05E-08 | 0.0014442 |
| EGFR-Fab1-mutFab2 | T97D | 2.8 | 13.51117644 | -7.41E-10 | -0.000179 |
| EGFR-Fab1-mutFab2 | T97S | 2.6 | 13.51115395 | -3.08E-10 | -0.000128 |
| EGFR-Fab1-mutFab2 | G30TYR | 1.8 | 13.51113315 | -1.23E-09 | -0.000246 |
| EGFR-Fab1-mutFab2 | Q27TYR | 2.1 | 13.51115383 | -4.34E-10 | -0.000129 |
| EGFR-Fab1-mutFab2 | A25V | 3.0 | 13.51110474 | 3.28E-09 | -0.000408 |

Experiment's Kd data/ Calculation Data
Part I:(A)
Calculated
Calculated
Experiment
Experiment
Protein complexes are the fundamental units of many biological functions. Despite their many advantages, one major adverse impact of protein complexes is accumulations of unassembled subunits that may disrupt other processes or exert cytotoxic effects. Synthesis of excess subunits can be inhibited via negative feedback control or they can be degraded more efficiently than assembled subunits, with this latter being termed cooperative stability. Whereas controlled synthesis of complex subunits has been investigated extensively, how cooperative stability acts in complex formation remains largely unexplored. To fill this knowledge gap, we have built quantitative models of heteromeric complexes with or without cooperative stability and compared their behaviours in the presence of synthesis rate variations. antibody discovery
Monoclonal antibodies (mAbs) are widely used therapeutics against cancer, autoimmune, and infectious diseases. The global mAb market is forecasted to grow to >$ 300 billion in 2025. Despite their commercial success, mAb discovery remains a resource- and time-consuming process resulting in a costly and lengthy clinical approval, hindering accessibility and affordability. A successful mAb molecule should not only show sufficient affinity in its target binding profile but also exhibit a desirable “developability” profile9. The term “developability” refers to a combination of intrinsic physicochemical parameters defined as developability parameters (DPs) that relate to biophysical aspects of antibodies and their formulations—including aggregation, solubility, and stability. The feasibility of an antibody candidate to successfully progress from discovery to development is underpinned by specific DPs, which reflect its manufacturability and druggability. Thus, suboptimal developability is one of the main factors of mAbs failure in preclinical and clinical development stages. Therefore, the ability to predict and prospectively design developability properties, in line with clinical and manufacturing requirements, would help by reducing the time and resources invested in developing therapeutic mAbs, thus, boosting their success rate.
Monoclonal antibodies (mAbs) are widely used therapeutics against cancer, autoimmune, and infectious diseases. The global mAb market is forecasted to grow to >$ 300 billion in 2025. Despite their commercial success, mAb discovery remains a resource- and time-consuming process resulting in a costly and lengthy clinical approval, hindering accessibility and affordability. A successful mAb molecule should not only show sufficient affinity in its target binding profile but also exhibit a desirable “developability” profile9. The term “developability” refers to a combination of intrinsic physicochemical parameters defined as developability parameters (DPs) that relate to biophysical aspects of antibodies and their formulations—including aggregation, solubility, and stability. The feasibility of an antibody candidate to successfully progress from discovery to development is underpinned by specific DPs, which reflect its manufacturability and druggability. Thus, suboptimal developability is one of the main factors of mAbs failure in preclinical and clinical development stages. Therefore, the ability to predict and prospectively design developability properties, in line with clinical and manufacturing requirements, would help by reducing the time and resources invested in developing therapeutic mAbs, thus, boosting their success rate.

Stability Analysis of log(cond(W)) for Antibody FAbs Mutations
Impact of Fab1 and Fab2 Mutations on Entropy in the EGFR–Fabs Complex
Direct Correlation Between Predicted and Experimental Kd Values
The type of correlation observed is directly influenced by the magnitude and sign of the entropy change—specifically, whether the entropy increases or decreases—within the EGFR–Fab1–Fab2 complex upon introducing single-point mutations in either Fab1 or Fab2.
Entropy Variation vs. Experimental Kd in EGFR–Fabs Complexes.
The graphs show the dependence of the entropy chang on the experimental Kd. Note the presence of negative and positive areas of entropy change when introducing point mutations into Fab1 or Fab2
The graphs show the dependence of the entropy chang on the experimental Kd. Note the presence of negative and positive areas of entropy change when introducing point mutations into Fab1 or Fab2
Correlation graph between experimental Kd and calculated lg[Kd], as well as indication of the point mutation T97C in Fab2 that "fell out" of the general graph
The graphs are devoted to the study of the influence of point mutation T97C Fab2 and its impact on the binding of intermediate biological formations Fab1-mutFab2, EGFR-Fab1-mutFab2
R=76%
R=73%
R=86%
R=-60%
This section highlights the strong correlation between computationally predicted dissociation constants (Kd) and experimentally measured Kd values.
Calculated
Calculated
Calculated
Calculated
Calculated
Calculated
Experiment
Experiment
Experiment
Experiment
Experiment
In statistics, correlation or dependence is any statistical relationship, whether causal or not, between two random variables or bivariate data. In the broadest sense correlation is any statistical association, though it commonly refers to the degree to which a pair of variables are linearly related. Familiar examples of dependent phenomena include the correlation between the height of parents and their offspring, and the correlation between the price of a good and the quantity the consumers are willing to purchase, as it is depicted in the so-called demand curve. Correlations are useful because they can indicate a predictive relationship that can be exploited in practice. For example, an electrical utility may produce less power on a mild day based on the correlation between electricity demand and weather. In this example, there is a causal relationship, because extreme weather causes people to use more electricity for heating or cooling. However, in general, the presence of a correlation is not sufficient to infer the presence of a causal relationship (i.e., correlation does not imply causation). Formally, random variables are dependent if they do not satisfy a mathematical property of probabilistic independence. In informal parlance, correlation is synonymous with dependence. However, when used in a technical sense, correlation refers to any of several specific types of mathematical operations between the tested variables and their respective expected values. Essentially, correlation is the measure of how two or more variables are related to one another. There are several correlation coefficients, often denoted ρ or r, measuring the degree of correlation. The most common of these is the Pearson correlation coefficient, which is sensitive only to a linear relationship between two variables (which may be present even when one variable is a nonlinear function of the other). Other correlation coefficients – such as Spearman's rank correlation – have been developed to be more robust than Pearson's, that is, more sensitive to nonlinear relationships. Mutual information can also be applied to measure dependence between two variables

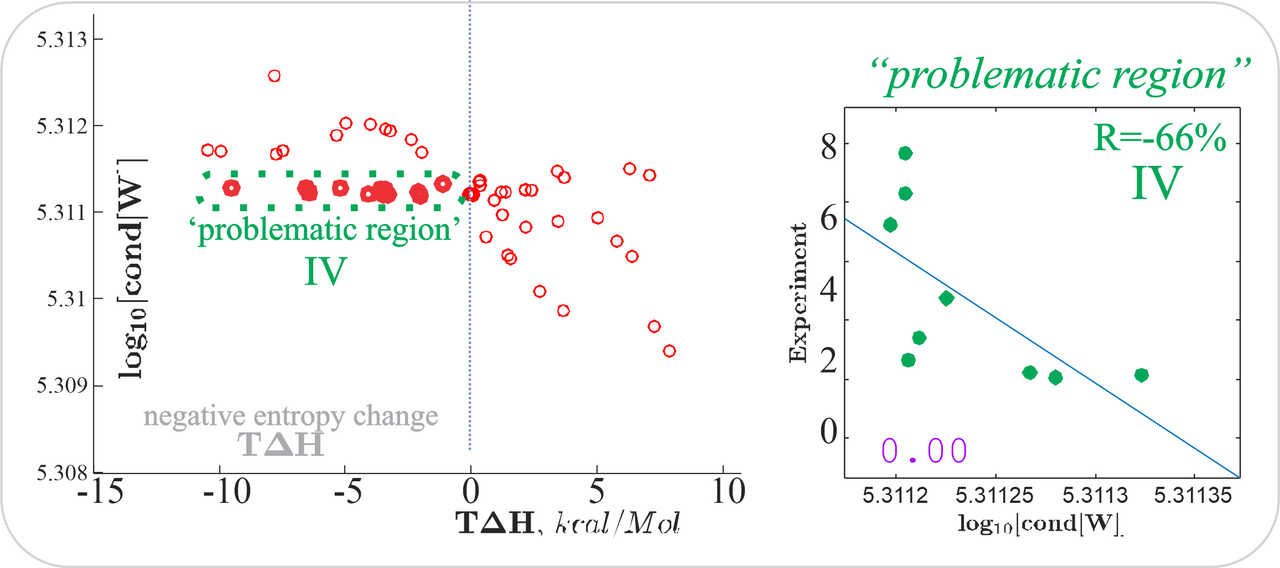
a) graph of two calculated parameters: the stability parameter lg(cond(W)) and the measure of entropy change.
As we can see, in this case the graph represents the inverse correlation dependence of these two quantities for the selected compound: EGFR-Fab1-Fab2
As we can see, in this case the graph represents the inverse correlation dependence of these two quantities for the selected compound: EGFR-Fab1-Fab2


in Fig.a) the region I is highlighted for which the correlation dependence between the calculated and experimental values is presented.
fig. b) contains the correlation result for the selected region in Fig.a)
When calculating the correlation, we cut off the experimental values from zero to 0.9, since they include the largest number of fluctuations around zero
When calculating the correlation, we cut off the experimental values from zero to 0.9, since they include the largest number of fluctuations around zero
How Do Different Sections of the Calculated Graphs Correlate with Experimental Data?
Problematic Region of the Calculated Graph: This segment of the computational plot shows pronounced fluctuations in stability during large changes in entropy
III - section of the calculated graph containing negative values of entropy change,
II - contains values that are in good inverse correlation
e) A dependence correlation graph of calculated (stability parameter) and the experimental value in the region of negative values of entropy changes.
f) a correlation graph between the entropy change measures and the experimental data. In this case, we cut off the experimental data in the region of fluctuations in the region of zero.
g) a visual graph of the dependence of the entropy change measure on the experimental data under conditions of negative and positive entropy changes
Part I:(B)
Problematic Region of the Calculated Graph
Explore a detailed breakdown of graph segments derived from computational models and see how each aligns with real-world experimental results. Identify patterns, validate predictions, and uncover insights across specific affinity regions.

We examine the obtained data, which are in the area of negative values of entropy change and are practically comparable in terms of the stability level
Сorrelation graph of calculated and experimental data in the region of negative values of entropy changes
| Mutation Pair | Affinity Change | log(cond(W)) |
|---|---|---|
| VH:W52D, VL:WT | 0.04 | 5.311281 |
| VH:W52H, VL:WT | 0.06 | 5.311280 |
| VH:I51F, VL:WT | 0.15 | 5.311323 |
| VH:W52M, VL:WT | 0.23 | 5.311267 |
| VH:T57M, VL:WT | 0.65 | 5.311206 |
| VH:T57N, VL:WT | 1.41 | 5.311211 |
| VH:T57H, VL:WT | 2.74 | 5.311225 |
| VH:T57S, VL:WT | 5.23 | 5.311197 |
| VH:T57P, VL:WT | 6.30 | 5.311204 |
| VH:T57P, VL:WT | 7.65 | 5.311204 |
This table presents calculated changes in antibody–antigen binding affinity resulting from specific point mutations in the VH region (while keeping VL constant as wild-type). Each row indicates the mutation, the corresponding affinity change (in unspecified units), and a stability-related parameter (e.g., log[cond(W)]).
Experimental data was taken [Deep mutational scanning of an antibody against epidermal growth factor receptor using mammalian cell display and massively parallel pyrosequencing]
Comparative Table of Experimental vs. Calculated Antibody–Antigen Affinity Data
The Enrichment Ratio (ER) is a measure used in deep mutational scanning experiments to quantify how much a particular antibody variant is enriched or depleted in a sorted population of high-affinity binders relative to its frequency in the initial (unsorted) library.
ER is relative to the sorting threshold set by fluorescence intensity (i.e., concentration of antigen used). It reflects functional binding behavior in the assay context (e.g., cell-surface display), not just thermodynamics.
High ER → variant binds better (slower off-rate or faster on-rate).
Low ER → variant binds poorly or not at all.
High ER → variant binds better (slower off-rate or faster on-rate).
Low ER → variant binds poorly or not at all.
Protein complexes are the fundamental units of many biological functions. Despite their many advantages, one major adverse impact of protein complexes is accumulations of unassembled subunits that may disrupt other processes or exert cytotoxic effects. Synthesis of excess subunits can be inhibited via negative feedback control or they can be degraded more efficiently than assembled subunits, with this latter being termed cooperative stability. Whereas controlled synthesis of complex subunits has been investigated extensively, how cooperative stability acts in complex formation remains largely unexplored. To fill this knowledge gap, we have built quantitative models of heteromeric complexes with or without cooperative stability and compared their behaviours in the presence of synthesis rate variations. A system displaying cooperative stability is robust against synthesis rate variations as it retains high dimer/monomer ratios across a broad range of parameter configurations. Moreover, cooperative stability can alleviate the constraint of limited supply of a given subunit and makes complex abundance more responsive to unilateral upregulation of another subunit.
Pearson's correlation coefficient", commonly called simply "the correlation coefficient". Mathematically, it is defined as the quality of least squares fitting to the original data. It is obtained by taking the ratio of the covariance of the two variables in question of our numerical dataset, normalized to the square root of their variances. Mathematically, one simply divides the covariance of the two variables by the product of their standard deviations.
It has improved clinical variant interpretation and provided insights into the biophysical modeling and mechanistic models of genetic variants Taking enzymes as an example, these phenotypes could include catalytic activity or stability For a transcription factor, the phenotype could be DNA binding specificity or transcriptional activity The relevant phenotype for a membrane transporter might be folding and trafficking or substrate transport These phenotypes are often captured by growth-based binding-based or fluorescence-based assays Those experiments are inherently differently designed and merit separate analysis frameworks. In growth-based assays, the relative growth rates of cells are of interest. In a binding-based assay, the selection probabilities are of interest. In fluorescence-based assays, changes to the distribution of reporter gene expression are measured. In this paper, we focus solely on growth-based screens.
It has improved clinical variant interpretation and provided insights into the biophysical modeling and mechanistic models of genetic variants Taking enzymes as an example, these phenotypes could include catalytic activity or stability For a transcription factor, the phenotype could be DNA binding specificity or transcriptional activity The relevant phenotype for a membrane transporter might be folding and trafficking or substrate transport These phenotypes are often captured by growth-based binding-based or fluorescence-based assays Those experiments are inherently differently designed and merit separate analysis frameworks. In growth-based assays, the relative growth rates of cells are of interest. In a binding-based assay, the selection probabilities are of interest. In fluorescence-based assays, changes to the distribution of reporter gene expression are measured. In this paper, we focus solely on growth-based screens.
| Mutations | ER value Experiment | ER unit | lg(cond(W)) Calculated | lg[Kd]Calculated | ΔS Calculated |
|---|---|---|---|---|---|
| VH:N31A, VL:WT | 0.55 | unitless | 5.30465489678283 | 10.0658563982087 | 10.6884556723072 |
| VH:N31C, VL:WT | 0.11 | unitless | 5.30442207977766 | 10.7973656236084 | 19.0040367707908 |
| VH:N31D, VL:WT | 4.59 | unitless | 5.31188933096192 | 8.65617641931785 | -5.33636646176843 |
| VH:N31E, VL:WT | 0.14 | unitless | 5.31170210190819 | 9.0381746433799 | -9.93923367649596 |
| VH:N31F, VL:WT | 0.47 | unitless | 5.3066766753011 | 9.49042437011593 | 4.14711521783524 |
| VH:N31G, VL:WT | 0.13 | unitless | 5.30551673805124 | 9.68197393060808 | 6.32459346040042 |
| VH:N31H, VL:WT | 0.87 | unitless | 5.31183727104048 | 8.91781599394633 | -2.36212493482854 |
| VH:N31L, VL:WT | 0.24 | unitless | 5.30676771639821 | 11.5291283549269 | 4.02929900054731 |
| VH:N31M, VL:WT | 0.59 | unitless | 5.31071532255824 | 9.17829320396885 | 0.598902539736517 |
| VH:Y32A, VL:WT | 0.06 | unitless | 5.30939896159341 | 9.81909103670964 | 7.88330262428721 |
| VH:Y32C, VL:WT | 0.05 | unitless | 5.30936087535049 | 10.5263573240586 | 15.9232972668682 |
| VH:Y32D, VL:WT | 0.1 | unitless | 5.31257739462971 | 8.43739323112317 | -7.82342884490631 |
| VH:Y32F, VL:WT | 0.08 | unitless | 5.31046358008294 | 9.26372446650866 | 1.57005979924854 |
| VH:Y32G, VL:WT | 0.03 | unitless | 5.30986373918694 | 9.44875550357587 | 3.67343772837489 |
| VH:Y32I, VL:WT | 0.14 | unitless | 5.31008544074025 | 9.36568301240269 | 2.72909426878821 |
| VH:Y32K, VL:WT | 0.03 | unitless | 5.30967967472341 | 9.76686040552305 | 7.2895603726539004 |
| VH:Y32L, VL:WT | 0.08 | unitless | 5.31050840232109 | 9.25369298404079 | 1.45602489026877 |
| VH:V50A, VL:WT | 0.17 | unitless | 5.31048931728494 | 9.68790158072128 | 6.39198020914719 |
| VH:V50C, VL:WT | 0.38 | unitless | 5.31044029286534 | 10.3967219798981 | 14.4496415304239 |
| VH:V50E, VL:WT | 7.11 | unitless | 5.31203358722249 | 8.68708047902286 | -4.98505813563285 |
| VH:V50F, VL:WT | 0.04 | unitless | 5.31119672957361 | 9.13166911060683 | 0.068893875884354 |
| VH:V50G, VL:WT | 0.05 | unitless | 5.31082720927245 | 9.31693696969268 | 2.1749640652004 |
| VH:V50I, VL:WT | 10.09 | unitless | 5.31097072519356 | 9.23374933229885 | 1.22931161065827 |
| VH:V50K, VL:WT | 0.83 | unitless | 5.31066649920348 | 9.63630720214493 | 5.80547062776929 |
| VH:V50L, VL:WT | 8.07 | unitless | 5.31122208259665 | 9.12162708500717 | -0.0452608958953277 |
| VH:V50M, VL:WT | 2.8 | unitless | 5.31196145694277 | 8.82657514192204 | -3.39932397098418 |
| VH:V50N, VL:WT | 3.77 | unitless | 5.31201369991092 | 8.7742789471631 | -3.99381166611559 |
| VH:V50P, VL:WT | 0.02 | unitless | 5.3119399986352 | 8.84192918900601 | -3.22478370252831 |
| VH:V50Q, VL:WT | 12.73 | unitless | 5.31137231613444 | 9.15800770524636 | 0.368303359674853 |
| VH:V50R, VL:WT | 0.04 | unitless | 5.31089334476205 | 9.42949465373925 | 3.45448667670609 |
| VH:V50S, VL:WT | 0.02 | unitless | 5.31169581275435 | 8.95333444080075 | -1.95836178493373 |
| VH:V50T, VL:WT | 0.03 | unitless | 5.31120136135828 | 9.12981830573242 | 0.0478544744017033 |
| VH:I51A, VL:WT | 6.83 | unitless | 5.31093932115807 | 9.56816054308819 | 5.03079965789813 |
| VH:I51C, VL:WT | 7.96 | unitless | 5.31092731501162 | 10.2585579985209 | 12.8790344074327 |
| VH:I51D, VL:WT | 3.66 | unitless | 5.31171904173924 | 0.00804452669750908 | -10.4727364041978 |
| VH:I51F, VL:WT | 0.15 | unitless | 5.31132335383009 | 9.02588419510022 | -1.13363778505738 |
| VH:I51G, VL:WT | 7.28 | unitless | 5.31113578605421 | 9.20676059621936 | 0.92251171258254 |
| VH:I51H, VL:WT | 1.17 | unitless | 5.31171287267527 | 8.46602096430725 | -7.49799772439746 |
| VH:W52A, VL:WT | 0.03 | unitless | 5.31142797525432 | 9.74899572846912 | 7.08648102805475 |
| VH:W52C, VL:WT | 0.09 | unitless | 5.31184423077815 | 10.535958240342 | 16.0324391272039 |
| VH:W52D, VL:WT | 0.04 | unitless | 5.31128077649815 | 8.28634407597585 | -9.5405118814257 |
| VH:W52E, VL:WT | 0.04 | unitless | 5.31128026385063 | 8.66886755971091 | -5.19209767964454 |
| VH:W52F, VL:WT | 0.39 | unitless | 5.31121239743305 | 9.13387733087787 | 0.0939962822701854 |
| VH:W52G, VL:WT | 7.68 | unitless | 5.31125469333299 | 9.33763982617885 | 2.41030828841955 |
| VH:W52H, VL:WT | 0.06 | unitless | 5.31128023519849 | 8.54786427327254 | -6.56762737030931 |
| VH:W52I, VL:WT | 4.7 | unitless | 5.31122924320887 | 9.24587905922437 | 1.36719892401219 |
| VH:W52K, VL:WT | 0.03 | unitless | 5.31149855093895 | 9.6787716523196 | 6.28819447298958 |
| VH:W52L, VL:WT | 0.28 | unitless | 5.31121185207414 | 9.12291002632816 | -0.0306768032108833 |
| VH:W52M, VL:WT | 0.23 | unitless | 5.31126716827709 | 8.80934518450926 | -3.59518945896586 |
| VH:W52P, VL:WT | 0.02 | unitless | 5.31126446306588 | 8.82510160395692 | -3.41607512899627 |
| VH:W52Q, VL:WT | 0.21 | unitless | 5.31130931853346 | 9.15802919961531 | 0.368547663991 |
| VH:W52R, VL:WT | 0.16 | unitless | 5.31140188692081 | 9.45239279770873 | 3.71478632890049 |
| VH:W52S, VL:WT | 0.06 | unitless | 5.31123587853955 | 8.9414482608198 | -2.09348064761582 |
| VH:W52T, VL:WT | 6.54 | unitless | 5.31121228015027 | 9.13185516690879 | 0.0710089182975722 |
| VH:W52V, VL:WT | 0.7 | unitless | 5.31121204151 | 9.12725709795977 | 0.0187394257713237 |
| VH:T57G, VL:WT | 6.84 | unitless | 5.31125789103379 | 9.31516580724754 | 2.15483026803873 |
| VH:T57H, VL:WT | 2.74 | unitless | 5.31122518445683 | 8.55958533857492 | -6.43438578774125 |
| VH:T57I, VL:WT | 0.23 | unitless | 5.31123473263104 | 9.23087220863167 | 1.19660547347694 |
| VH:T57L, VL:WT | 0.13 | unitless | 5.31121053747604 | 9.11731627091173 | -0.0942649666260759 |
| VH:T57M, VL:WT | 0.65 | unitless | 5.31120591423376 | 8.81963438646642 | -3.47822488049714 |
| VH:T57N, VL:WT | 1.41 | unitless | 5.31121132536026 | 8.76717302623067 | -4.07459015578779 |
| VH:T57P, VL:WT | 7.65 | unitless | 5.3112043408725 | 8.83505385032192 | -3.30294096170009 |
| VH:T57Q, VL:WT | 1.13 | unitless | 5.31135534781724 | 9.15261134028488 | 0.306959063488441 |
| VH:T57R, VL:WT | 0.12 | unitless | 5.31148018247654 | 9.42663082562225 | 3.42193187077471 |
| VH:T57S, VL:WT | 5.23 | unitless | 5.31119690101269 | 8.94720197360279 | -2.02807415989505 |
| VH:D58A, VL:WT | 0.07 | unitless | 5.30954802755892 | 10.5279540547397 | 15.941448541957 |
| VH:Y59C, VL:WT | 5.62 | unitless | 5.30966973705319 | 10.4123699335681 | 14.6275223970058 |
| VH:Y59D, VL:WT | 4.17 | unitless | 5.31167102687009 | 8.44429427330501 | -7.74498036785361 |
| VH:V50L, VL:WT | 7.5 | unitless | 5.31122208259665 | 9.12162708500717 | -0.0452608958953277 |
| VH:V50Q, VL:WT | 7.0 | unitless | 5.31137231613444 | 9.15800770524636 | 0.368303359674853 |
| VH:I51G, VL:WT | 6.4 | unitless | 5.31113578605421 | 9.20676059621936 | 0.92251171258254 |
| VH:W52G, VL:WT | 5.0 | unitless | 5.31125469333299 | 9.33763982617885 | 2.41030828841955 |
| VH:W52T, VL:WT | 4.0 | unitless | 5.31121228015027 | 9.13185516690879 | 0.0710089182975722 |
| VH:T57G, VL:WT | 4.8 | unitless | 5.31125789103379 | 9.31516580724754 | 2.15483026803873 |
| VH:T57P, VL:WT | 6.3 | unitless | 5.3112043408725 | 8.83505385032192 | -3.30294096170009 |
| VH:T57S, VL:WT | 2.1 | unitless | 5.31119690101269 | 8.94720197360279 | -2.02807415989505 |
| VH:Y59C, VL:WT | 2.2 | unitless | 5.30966973705319 | 10.4123699335681 | 14.6275223970058 |
The last 9 lines contain the value: FACS affinity (xWT)
You can Use Open-Access Antibody Data to Build and Test Your Machine Learning Models
Leverage the full set of open biological data provided here to develop custom machine learning algorithms, train predictive models, and validate computational methods for antibody–antigen interaction analysis.
Part 2:0
Antibody Mutation Analysis Dataset – Predict Affinity and Reduce Lab Costs
Reasons to Choose Our Service
We work hard every day to make life of our clients better and happier
- QualityWe are a leading firm in providing quality and value to our customers.
- SupportOur managers are always ready to answer your questions. You can call us at the weekends and at night.
- FlexibilityThis method allows us to achieve success in problems of all levels.
- ExperienceEach member of our team has at least 5 years of legal experience.
- PresentsWe like to make people happy. We ask our clients about their birthday and prepare cool presents.
- EfficiencyWe care about our clients' time. Just give us a call, and we will help you with all the questions.
